TabICL 是一款开源表格基础模型,原生支持分类与回归任务,同时可拓展应用至时间序列预测等场景。它完整兼容 scikit-learn API,使用习惯对数据从业者十分友好。不同于传统机器学习模型,TabICL 在调用 fit 时仅缓存训练数据,真正基于上下文学习的推理计算,延后至 predict 阶段执行。
安装
通过 pip 安装 TabICL:
如果扩展到时间序列预测,则需要安装依赖:
1
| pip install "tabicl[forecast]"
|
功能介绍
TabICL 提供的功能包括:
tabicl.TabICLClassifier - 实现表格数据分类tabicl.TabICLRegressor - 实现表格数据回归tabicl.forecast.TabICLForecaster - 实现时间序列预测tabicl.TabICLUnsupervised - 实现无监督学习tabicl.FinetunedTabICLClassifier - 微调 TabICL 权重实现分类tabicl.FinetunedTabICLRegressor - 微调 TabICL 权重实现回归
原生模型(TabICLClassifier、TabICLRegressor)与微调模型(FinetunedTabICLClassifier、FinetunedTabICLRegressor)的区别:
- 原生:上下文学习 ICL,全程不更新模型权重
- 微调:监督微调,使用目标数据集更新预训练权重
分类问题
结合现在大 A 的“水深火热”,回答一个最朴素的问题:“明天还会涨吗?”
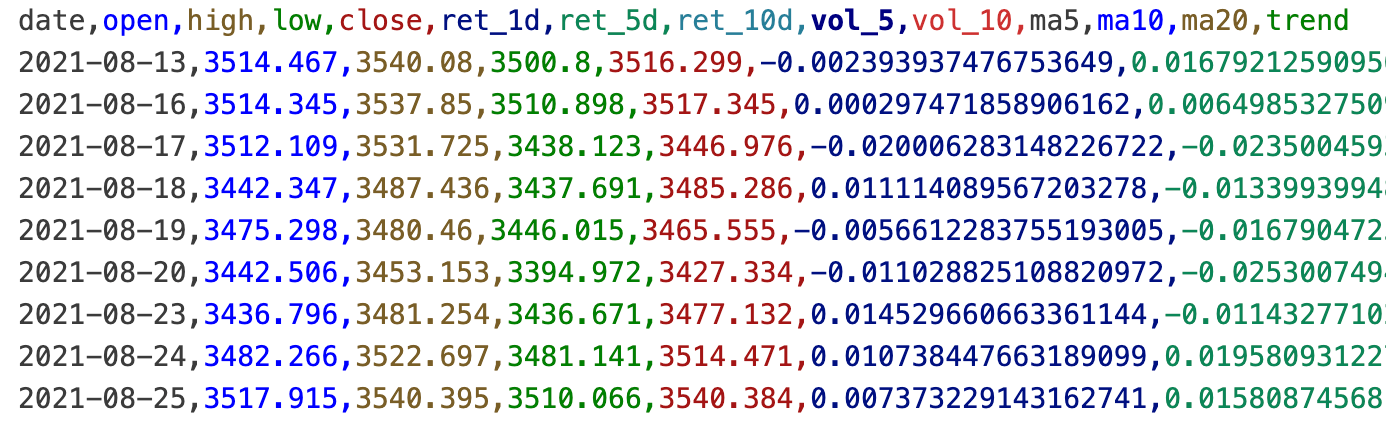
数据集介绍

- date:日期
- open:开盘价
- high:最高价
- low:最低价
- close:收盘价
- ret_1d:一日收益率
- ret_5d:五日收益率
- ret_10d:十日收益率
- vol_5:五日波动率
- vol_10:十日波动率
- ma5:五日均线
- ma10:十日均线
- ma20:十日均线
- trend:次日涨跌标签,
1 涨 0 跌
收集了 2021-08-13 到 2026-07-30 的上证指数数据,共计 1201 条数据。
2026-07-30 预测 31 号的涨跌,所以试验中不用这条数据。
完整代码如下:
 1
 2
 3
 4
 5
 6
 7
 8
 9
10
11
12
13
14
15
16
17
18
19
20
21
22
23
24
25
26
27
28
29
30
31
32
33
34
35
36
| import pandas as pd
import matplotlib.pyplot as plt
from tabicl import TabICLClassifier
from sklearn.metrics import accuracy_score, confusion_matrix, ConfusionMatrixDisplay
# 中文显示
plt.rcParams['font.sans-serif'] = ['Arial Unicode MS']
plt.rcParams['axes.unicode_minus'] = False
# 读取数据集
df = pd.read_csv('sh000001.csv')
# 取前 1200 条记录,拆分特征和标签
X = df.iloc[:-1][['open', 'high', 'low', 'close', 'ret_1d', 'ret_5d', 'ret_10d', 'vol_5', 'vol_10', 'ma5', 'ma10', 'ma20']]
Y = df.iloc[:-1]['trend']
# 按 0.8 拆分数据集,80% 作为训练集(960 条),20% 作为测试集(240 条)
split_idx = int(len(X) * 0.8)
X_train, X_test = X.iloc[:split_idx], X.iloc[split_idx:]
y_train, y_test = Y.iloc[:split_idx], Y.iloc[split_idx:]
# 实例化 TabICLClassifier 并 fit 训练集
clf = TabICLClassifier(verbose=True)
clf.fit(X_train, y_train)
# 预测测试集标签
y_pred = clf.predict(X_test)
acc = accuracy_score(y_test, y_pred)
print(f"测试集准确率: {acc:.3f}")
# 混淆矩阵
cm = confusion_matrix(y_test, y_pred)
disp = ConfusionMatrixDisplay(confusion_matrix=cm, display_labels=["下跌/持平(0)", "上涨(1)"])
disp.plot(cmap="Blues")
plt.title("TabICL 测试集混淆矩阵")
plt.savefig("sh000001_confusion_matrix.png")
|
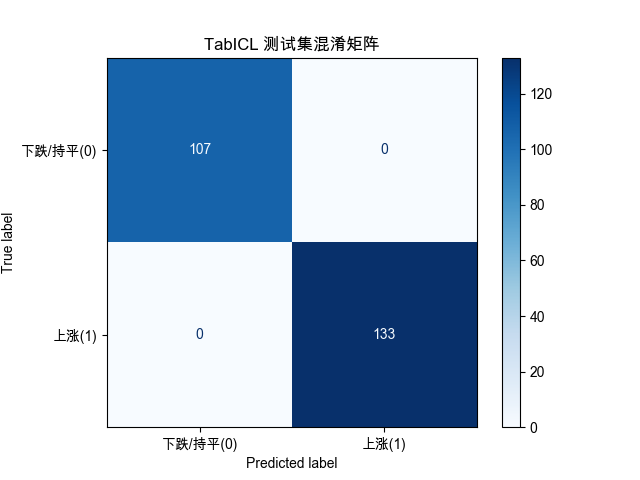
跑出的结果非常吓人:测试集准确率 100%。
不敢相信!!!
现在是 7 月 31 号,今天的上证收于 3,832.26,所以 7 月 30 号的 trend 应该是 1,所以用前 1200 条记录去 fit 模型,然后用 7 月 30 条的去预测。
 1
 2
 3
 4
 5
 6
 7
 8
 9
10
11
12
13
14
15
16
17
18
| import pandas as pd
from tabicl import TabICLClassifier
# 读取数据集
df = pd.read_csv('sh000001.csv')
# 取前 1200 条记录,拆分特征和标签
X = df.iloc[:-1][['open', 'high', 'low', 'close', 'ret_1d', 'ret_5d', 'ret_10d', 'vol_5', 'vol_10', 'ma5', 'ma10', 'ma20']]
Y = df.iloc[:-1]['trend']
x = df.iloc[-1:][['open', 'high', 'low', 'close', 'ret_1d', 'ret_5d', 'ret_10d', 'vol_5', 'vol_10', 'ma5', 'ma10', 'ma20']]
clf = TabICLClassifier(verbose=True)
clf.fit(X, Y)
y_proba = clf.predict_proba(x)
print(f"{y_proba[0][0]} 下跌/持平,{y_proba[0][1]} 上涨")
|
执行结果:
1
| 0.9999986290931702 下跌/持平,1.3714894748773077e-06 上涨
|
其实就是百分百下跌/持平,但今天是上涨 0.72%!
真的是,实验猛如虎,结果如同狗,让 TabICL 去预测大 A 的涨跌,确实有点难为他了。
后续
后续还会用 TabICL 提供的其它功能,去做一些有意思的实验。
参考资料